This graph shows the marginal cost and marginal benefit associated with roadside litter clean up. Assume that the marginal benefit curve and marginal cost curve each have their usual slope. 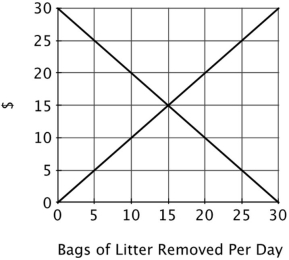 A state initiative requiring towns to spend at least $20 per day on litter removal would be ______ because ______.
Definitions:
Q3: The figure below shows the marginal benefit
Q15: Suppose that all workers value a safe
Q17: Gino's Pizza shop hires workers in a
Q40: Photovoltaic cells work because solar energy striking
Q46: Pollution permit policies achieve an _ outcome
Q46: A policy maker has argued for higher
Q60: According to the Cost-Benefit Principle, you should
Q114: Your classmates from the University of Chicago
Q120: There are ten states in the democratic
Q126: Refer to the figure below. The socially