The figure shows a standard normal N(0, 1) distribution. Find the shaded area. 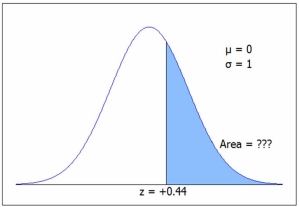 C.2. gives 1 - P(z < .44) = 1 - .6700 = .3300 =1-NORM.S.DIST(0.44,1) .
Definitions:
Wavelength
The distance between successive crests of a wave, especially points in a sound wave or electromagnetic wave.
Job Scope
The breadth and depth of a job.
Role Overload
A situation where an employee is expected to fulfill too many roles at once, potentially leading to stress and reduced job performance.
Role Ambiguity
The uncertainty experienced by individuals when they lack clear understanding of their job duties, authority, and responsibilities.
Q10: "Currently, only 20 percent of arrested drug
Q12: The following table gives a classification
Q16: Assuming unequal variances in a t-test for
Q22: In conducting a paired t-test of the
Q25: The MPG (miles per gallon) for a
Q66: Compared to the area between z =
Q81: A paired t-test with two columns of
Q100: The Poisson distribution can be skewed either
Q103: Independent events are mutually exclusive.
Q118: Given the contingency table shown here,