The figure shows a standard normal N(0, 1) distribution. Find the z value for the shaded area. 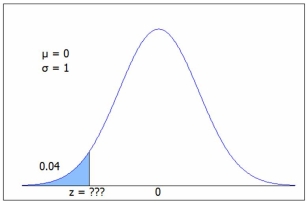 C.2 gives P(z < -1.75) = .0401 or use Excel =NORM.S.INV(0.04) = -1.75.
Definitions:
Accompanying Figure
An illustrative image or diagram provided to complement or clarify textual information, often found in books or academic papers.
Tester Program
A program designed to test the functionality of other software components or modules, often for errors or bugs.
Tests
Procedures for evaluating the functionality, reliability, or performance of a system or component.
Method
A function associated with an object or class in object-oriented programming, used to perform specific actions or calculations.
Q19: The number of male babies in a
Q23: The exponential distribution describes the number of
Q40: The expected value of a random variable
Q43: Information was collected on those who attended
Q46: Twelve randomly chosen students were asked
Q49: Three randomly chosen Colorado students were asked
Q51: Which is the most serious deceptive graphical
Q66: Compared to the area between z =
Q82: Varying the true mean is a movement
Q89: The general law of addition for probabilities