Multiple Choice
The figure shows a normal N(400, 23) distribution. Find the approximate shaded area. 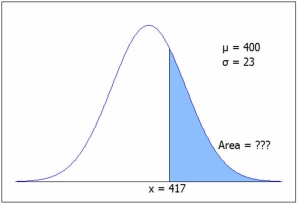 C.2 gives 1 - P(z < 0.74) = 1 - .7704 = .2296, or from Excel =1-NORM.DIST(417,400,23,1) = .2299.
Definitions:
Related Questions
Q3: Given the contingency table shown here,
Q40: The union of two events A and
Q42: Which is not true of p-values?<br>A)When they
Q43: Information was collected on those who attended
Q49: The critical value in a hypothesis test:<br>A)is
Q53: The figure shows a standard normal N(0,
Q73: In a left-tailed test, a statistician got
Q113: Which best exemplifies the empirical definition of
Q114: In hypothesis testing, we cannot prove a
Q140: For a given H<sub>o</sub> and level of