The figure shows a normal N(400, 23) distribution. Find the x value for the shaded area. 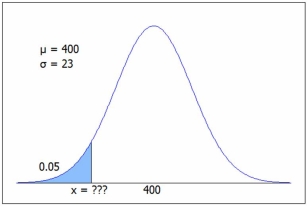 C.2 we get P(z < -1.645) = .05, so x = µ + zσ = 400 - 1.645(23) = 362.2, or from Excel =NORM.INV(0.05,400,23) = 362.2.
Definitions:
Treatments
Medical interventions or therapeutic methods used to cure, relieve, or prevent diseases and conditions.
Physiological Aspects
Components or features relating to the functions and processes of living organisms.
Community Supports
Services and resources available within a community to assist individuals in meeting their social, health, educational, and economic needs.
Developmental Tasks
Specific achievements and milestones that individuals are expected to reach at various stages of their life, contributing to their growth and maturity.
Q14: If the probability of success is .25,
Q18: In a random sample of patient records
Q60: In a test for equality of two
Q87: In a test of a new
Q91: As n increases, the standard error decreases.
Q97: The power curve plots β on the
Q97: Given the contingency table shown here,
Q115: The normal distribution is a good approximation
Q121: Which distribution is most nearly appropriate to
Q122: Which of the following is not a