Multiple Choice
Figure 3-7 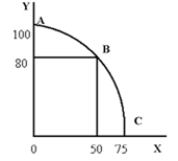
-What is the opportunity cost of moving from point B to point A in Figure 3-7?
Definitions:
Related Questions
Q30: The supply curve shows<br>A)the same basic information
Q44: Population density varies little between the fifty
Q75: The United States economy is<br>A)the third largest
Q92: In the fall of 1992,candidate Bill Clinton's
Q123: Total utility can be objectively measured in
Q159: Adam Smith noted that people are adept
Q170: Regulations are sometimes used to "correct" the
Q188: What mechanism assures that producers use inputs
Q258: When price is below the equilibrium level,there
Q263: A supply schedule can be plotted on