The following table depicts the production relationship between units of labor and output of pepper on Pietrov's Pepper Farm.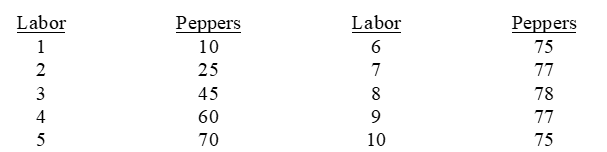
Graphically show the three zones of production corresponding to increasing,decreasing,and negative marginal product,noting the point of diminishing returns.
Definitions:
Production Possibilities Curves
A graphical representation that shows the maximum number of goods or services that can be produced with limited resources.
Constant Costs
Costs that do not change with the level of output production, remaining stable over a certain range of production.
Increasing Costs
A scenario where the costs of producing goods or services trend upwards over time, affecting profitability and pricing strategies.
World Price
The international market price of a good or service, determined by world demand and supply.
Q13: Total revenue<br>A)can be calculated directly from the
Q25: Why do economists measure responsiveness of demand
Q42: In Figure 5-8,the consumer is indifferent between
Q83: What are the main determinants of demand
Q122: In 1984,British Prime Minister Margaret Thatcher decided
Q146: A firm can choose a quantity of
Q159: "Plowback" is a preferred source of financing
Q174: Figure 5-16 shows Adam's purchases of bananas
Q179: Input proportions are usually fixed by technological
Q192: If the marginal cost of producing vanity