Figure 12-3
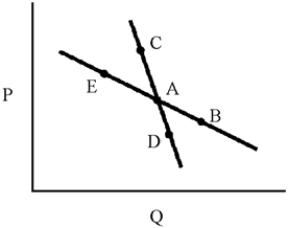
-In Figure 12-3, demand curve CAD represents a market in which oligopolists will match the price changes of rivals and demand curve EAB represents a market in which oligopolists will ignore the price changes of rivals.According to the kinked demand model, the relevant demand curve will be
Definitions:
Q45: Education is subsidized because it generates beneficial
Q80: Monopolistic competition is common in<br>A)retail selling.<br>B)farming.<br>C)basic manufacturing.<br>D)electric
Q82: Explain why firms that enjoy economies of
Q83: What are the four types of industry
Q110: Marginal social costs are the sum of
Q121: An oligopolist cares very much about what
Q127: Price discrimination by a firm is<br>A)illegal under
Q159: Game theory applies to problems that arise
Q190: Provide two circumstances where monopoly may offer
Q217: What quantity of output and price do