Figure 12-4
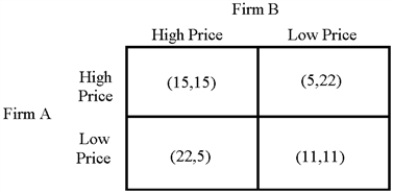
-The above matrix (Figure 12-4) displays the possible profit results of two firms, A and B, from following two different possible strategies: charging a high price and charging a low price.In each cell, the first number is the profit of firm A, and the second number is the profit of firm B.
a.Assume that collusion is not possible.Determine the optimal strategy for each firm.Explain why it is the best strategy to follow.
a., explain why firms collude.What are the pitfalls of collusion?
b.Based on your answer to
Definitions:
Mycorrhizae
Symbiotic associations between fungi and the roots of plants, improving nutrient and water uptake.
Epiphytes
Plants that grow on other plants for physical support but do not extract nutrients from their hosts, thus not parasitic.
Species Richness
A measure of the number of different species represented in an ecological community, landscape or region.
Disturbance Hypothesis
posits that disturbances in an ecosystem can create opportunities for new species to colonize, thus affecting biodiversity.
Q17: Productivity growth tends to affect all industries
Q20: Input-output analysis is a technique used to
Q45: Education is subsidized because it generates beneficial
Q73: Which of the following is an example
Q84: Which of the following functions is not
Q105: A monopolist is a price maker.
Q150: A monopolist is best described as a
Q164: Identify the market structure characterized by many
Q186: Monopolists may in the long run<br>A)earn positive
Q223: In Figure 12-2,which of the graphs represents