Multiple Choice
The following graph depicts demand. 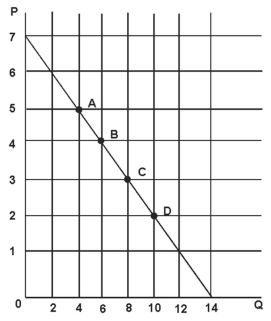
Refer to the figure above.The slope of the demand curve (if you ignore the negative sign) is:
Definitions:
Related Questions
Q4: Your neighbors have asked you to look
Q7: Barry owns a clothing store in the
Q10: The term marginal utility denotes the amount
Q31: Suppose 30 employee-hours can produce 50 units
Q59: Price ceilings that are below the equilibrium
Q79: Most people make some decisions based on
Q84: According to the textbook,the most important and
Q97: Ten years ago you had never even
Q111: When calculating price elasticity of demand,if the
Q117: When dealing with pure public goods,<br>A) the