This graph shows the cost functions of Moe's mushroom gathering business,which is perfectly competitive. 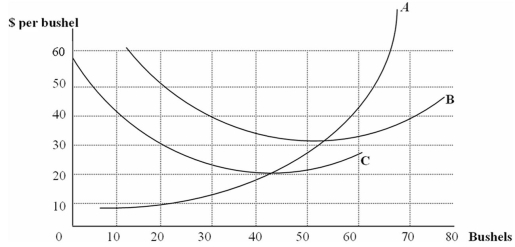
In the graph above,Average Variable Cost is labeled _____,Average Total Cost is labeled _____,and Marginal Cost is labeled ______.
Definitions:
MR < MC
A scenario where marginal revenue is less than marginal cost, suggesting it is not profitable to produce additional units.
Marginal Cost
A measurement of the cost incurred by producing one additional unit of a product or service.
Average Variable Cost
The per-unit cost that varies, calculated through the division of total variable costs by the quantity of products made.
Economic Profits
The financial gain made in a transaction after accounting for both explicit and implicit costs.
Q11: The profit maximizing rule MR = MC
Q45: A consumer has a reservation price of
Q48: An individual's supply curve shows his or
Q53: Patents and copyrights,which confer market power,exist to:<br>A)
Q65: When a drug company introduces a new
Q68: Firms will not produce if price is
Q80: To say that an individual possesses an
Q83: The market for bagels contains two
Q94: If the marginal cost of reducing pollution
Q96: Ten years ago you had never even