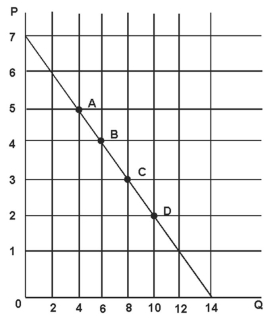
The following graph depicts demand. 
Refer to the figure above.The slope of the demand curve (if you ignore the negative sign) is:
Definitions:
Risk-Free Rate
The theoretical rate of return of an investment with zero risk, typically represented by the yield on government bonds.
Optimal Risky Portfolio
A portfolio of investments that maximizes expected return for a given level of risk by carefully selecting and weighting risky assets.
Expected Return
The anticipated amount of profit or loss an investment is likely to generate over a specific period.
Risk-Free Asset
A risk-free asset refers to an investment that theoretically provides a certain return with no risk of financial loss.
Q4: Pat's total utility after eating 100 Reese's
Q28: Total revenue minus total explicit and implicit
Q29: As coffee becomes more expensive,Joe starts drinking
Q32: Daily Supply and Demand: Oranges in Hurricane
Q39: Ingrid has been waiting for the show
Q57: According to the law of diminishing marginal
Q64: Your classmates from the University of Chicago
Q73: Several years ago there were two systems
Q74: The monopolist will maximize profits if it
Q90: You are the Minister of Trade for