The following summaries from the income statements and balance sheets of Kouris Company and Brittania, Inc. are presented below.
(1) For both companies for 2018, compute the:
(a) Current ratio
(b) Acid-test ratio
(c) Accounts receivable turnover
(d) Inventory turnover
(e) Days' sales in inventory
(f) Days' sales uncollected
Which company do you consider to be the better short-term credit risk? Explain.
(2) For both companies for 2018, compute the:
(a) Profit margin ratio
(b) Return on total assets
(c) Return on common stockholders' equity
Which company do you consider to have better profitability ratios?
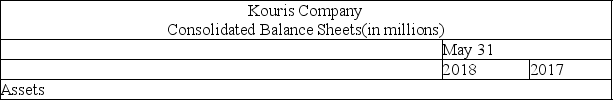 Current assets:Cash and cash equivalentsAccounts receivable, net of allowanceInventoriesOther current assetsTotal current assetsProperty, plant, and equipment, netOther long term assetsTotal assetsLiabilities and Stockholders’ Equity$634.02,101.11,514.9429.94,679.91,620.8413.9$6,713.9$575.51,804.11,373.8401.34,154.71,614.5670.8$6,440.0
Current liabilities:Current portion of long-term debtNotes payableAccounts payableAccrued liabilitiesIncome taxes payableTotal current liabilitiesLong term liabilitiesTotal liabilitiesStockholders’ equity:Common stockContributed capital in excess of par valueUnearned stock compensationAccumulated other comprehensive lossRetained earningsTotal stockholders’ equityTotal liabilities and stockholders’ equity$205.775.4572.71,054.2107.22,015.2708.02,723.22.8589.0(0.6)(239.7)3,639.23,990.7$6,713.9$55.3425.2504.4765.383.01,833.2767.82,601.02.8538.7(5.1)(192.4)3,495.03,839.0$6,440.0
Kouris CompanyConsolidated Statement of IncomeMay 31,2018(in millions)RevenuesCost of salesGrossprofitOperating expensesOperating incomeInterest expenseOther revenues and expensesIncome before taxIncome taxesIncome before effect of accounting changeCumulative effect of accounting change, net of taxNet income$10,697.06,313.64,383.43,137.61,245.842.979.91,123.0382.9740.1$266.1$474.0
Brittania, Inc.
Consolidated Balance Sheets
Jan. 3, 2018 Jan. 4, 2017
AssetsCurrent assets:Cash and cash equivalentsAccounts receivable, net of allowanceInventoriesOther current assetsTotal current assetsProperty, plant, and equipment, netOther long term assetsTotal assets$34.515.527.23.580.75.71.1$87.5$22.214.728.44.269.57.01.5$78.0
Liabilities and Stockholders’ Equity Current liabilities: Accounts payable Accrued liabilities Total current liabilities Long term liabilities Total liabilities Stockholders’ equity: Common stock Contributed capital in excess of par value Unearned stock compensation Accumulated other comprehensive loss Treasury stock Retained earnings Total stockholders’ equity $8.57.816.32.518.82.317.8(0.1)(6.9)55.968.7$87.5$16.65.612.22.614.82.317.4(0.5)(1.3)5.50.763.2$78.0 Brittania, Inc.Consolidated Statement of IncomeJanuary 3, 2018(in millions) Revenues Cost of sales Gross profit Operating expenses Operating income Interest expense Other revenues and expenses Income before tax Income taxes Net income $133.587.346.237.38.9(0.1)0.39.1$.9.2$.2.12
Definitions:
Career Growth
denotes the process of an individual’s professional progression through gaining skills, experiences, and responsibilities.
Collective Bargaining
Process of negotiation between management and union representatives.
Investor Relations
The department within a company tasked with managing communications and relationships with shareholders and the investment community.
Higher-Order Need
Needs that go beyond the basic physiological or safety requirements, such as social, ego, and self-actualization needs.