Consider the graphs that follow (the horizontal axis represents activity; the vertical axis represents total dollars). 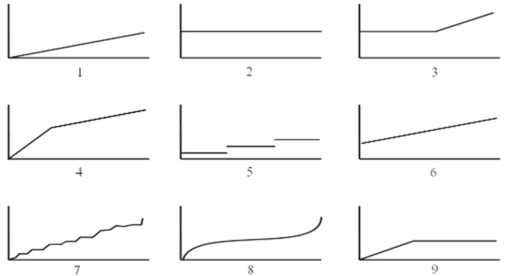 Required:
For items A-I that follow, choose the graph that best represents the cost behaviour pattern described. Note: Graphs can be used more than once.
A. Straight-line depreciation on machinery.
B. The cost of chartering a private airplane. The cost is $800 per hour for the first 6 hours of a flight; it then drops to $600 per hour.
C. The wages of table service personnel in a restaurant. The employees are part-time workers who can be called upon for as little as 4 hours at a time.
D. Weekly wages of store clerks who work 40 hours each week. One clerk is hired for every 125 sales made during the month.
E. The cost of tires used in the production of trucks.
Up to 20,000 kilowatt hours (KWH): $4,000
Above 20,000 kilowatt hours: $4,000 + $0.02 per KWH
Definitions:
Restrictions
Limitations or conditions imposed on activities, rights, or behaviors to regulate them.
Innocent Misrepresentation
A false statement made by one party to another, where the person making the statement genuinely believes it to be true.
Rescission
Rescission is a legal remedy that cancels a contract and returns the parties involved to their statuses prior to the contract, as if it never existed.
Rescission
The legal act of cancelling a contract and returning the parties involved to their positions prior to the agreement, as if the contract never existed.
Q3: When calculating unit costs under the weighted-average
Q5: Pickering Company produced and sold 45,000
Q7: An organization's budgets will not often be
Q8: The Glowmeter Manufacturing Company has two
Q11: The density of lead is 11.4
Q15: Sweetland Company, which uses the high-low
Q37: Assume that machine hours is the cost
Q44: Which variance is commonly associated with measuring
Q66: Iced tea is a mixture.
Q101: When advanced manufacturing systems are installed,