The following figure shows the marginal cost curve,average total cost curve,average variable cost curve,and marginal revenue curve for a firm for different levels of output.
Figure 9-3 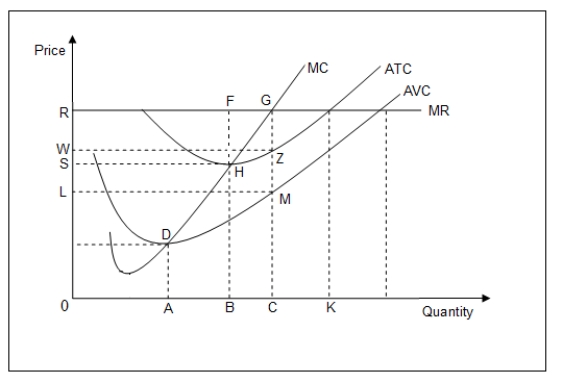
-Refer to Figure 9-3.At the profit-maximizing level of output:
Definitions:
Anecdotal
pertains to information or evidence based on personal accounts, observations, or non-scientific observations, rather than hard data or research.
Empirically Tested
Examined or verified through observation and experiment rather than theory or pure logic.
Quantitative
Pertaining to or measurable by the quantity of something rather than its quality.
Skills Approach
A perspective on leadership that emphasizes the importance of developing certain skills and abilities, such as technical, human, and conceptual skills, for effective leadership.
Q6: (<br>A)Consider a firm which produces baseball bats
Q7: Assume a competitive industry produces widgets using
Q14: The perfectly competitive firm minimizes losses by
Q21: The strategy of charging different prices to
Q26: What is a two-part tariff? Make up
Q34: First-degree price discrimination is _.<br>A)perfect because it
Q36: Although U.S.airline fares fell significantly after deregulation,profits
Q37: Two goods are allocated inefficiently between consumers
Q48: A risk-averse individual _.<br>A)prefers a sure return
Q58: Explain how the three primary conditions of