The following figure shows the marginal cost curve,average total cost curve,average variable cost curve,and marginal revenue curve for a firm for different levels of output.
Figure 9-3 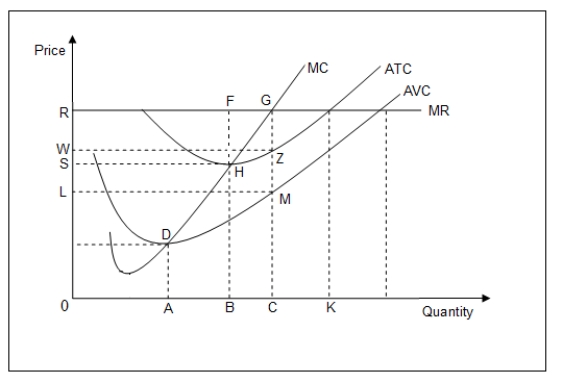
-Refer to Figure 9-3.At the output level OB,total profits equal the area given by _____.
Definitions:
Q18: Describe the relationship among total utility,marginal utility,and
Q27: Given that quotas benefit producers,who are few
Q28: Refer to Table 7-3.If the firm is
Q47: For the cubic total cost function TC
Q52: Consider a graph with a total variable
Q53: Which of the following is constant along
Q55: The local zoo has a pricing policy
Q57: In Figure 10-1,the net change in total
Q67: Average fixed cost [AFC] is the:<br>A)horizontal distance
Q121: Which of the following can be classified