The following figure shows the marginal cost curve,average total cost curve,average variable cost curve,and marginal revenue curve for a firm for different levels of output.
Figure 9-3 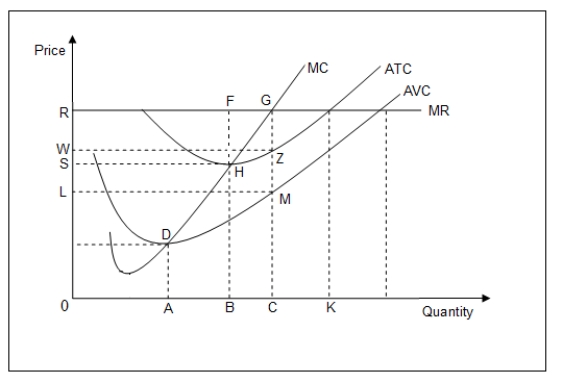
-Refer to Figure 9-3.If the market price is $10,average revenue _____.
Definitions:
Decision Making
The process of making choices by identifying a decision, gathering information, and assessing alternative resolutions.
Incremental Revenue
Additional income generated from selling more units of a product or from launching a new product or service.
Relevant Information
Information that is applicable and crucial to the decision-making process, having the ability to affect the outcome of a decision.
Opportunity Cost
The value of the best alternative foregone as a result of choosing a different option.
Q6: (<br>A)Consider a firm which produces baseball bats
Q16: Which of the following is true of
Q23: Acme Baseball Bats is a monopoly firm.If
Q24: Define and then derive the expression for
Q28: Refer to Table 7-3.If the firm is
Q42: If a firm doubles its usage of
Q53: Without trade the price of one unit
Q98: (<br>A)Assume two firms face a market demand
Q105: A firm that is operating in a
Q116: The technological relationships reflected in the firms'