Multiple Choice
The following figure shows the demand curve and the marginal revenue curve of a monopolist.On the horizontal axis,OG = GF.
Figure 11-5 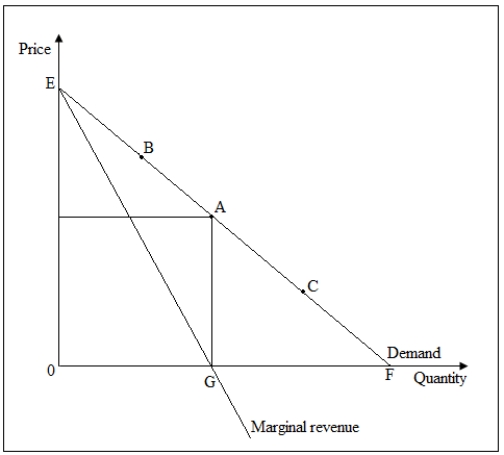
-Refer to Figure 11-5.A fall in price will increase total revenue _____.
Definitions:
Related Questions
Q1: The monopolist's demand curve slopes downward because:<br>A)the
Q7: A Nash equilibrium occurs when:<br>A)a unilateral move
Q8: Under which of the following game theory
Q8: Refer to Figure 11-5.Total revenue is equal
Q53: The long-run average cost curve always:<br>A)reflects the
Q57: Refer to Figure 11-5.A fall in price
Q75: A profit-maximizing monopoly firm that sells output
Q78: Peak-load pricing is typically introduced when:<br>A)there are
Q87: Using a graph,show the equilibrium price and
Q89: Which of the following would weaken the