True/False
The line chart below shows tomato prices each month from January (month 1)to December last year ($ per pound).By looking at this chart you can see the lowest tomato prices occurred in July. 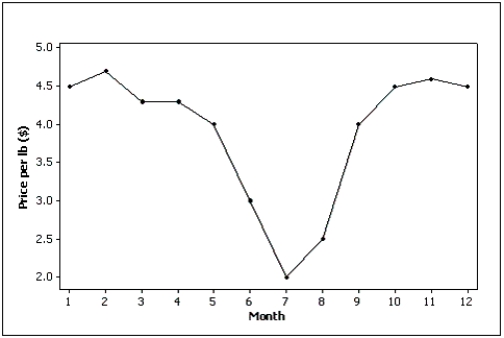
Definitions:
Related Questions
Q7: Which of the following is NOT a
Q14: Data that contains information on a single
Q19: Common stock represents a direct equity claim.
Q21: A manufacturer of microwave ovens wants to
Q22: A frequency distribution lists the categories and
Q50: A graph showing trends over time is
Q62: In the following cross-classification table,how are gender
Q77: The Chicago Board Options Exchange is now
Q143: If two events are collectively exhaustive,what is
Q190: Which of the following are measures of