The line chart below shows tomato prices each month from January (month 1)to December last year ($ per pound).By looking at this chart you can see the lowest tomato prices occurred in July. 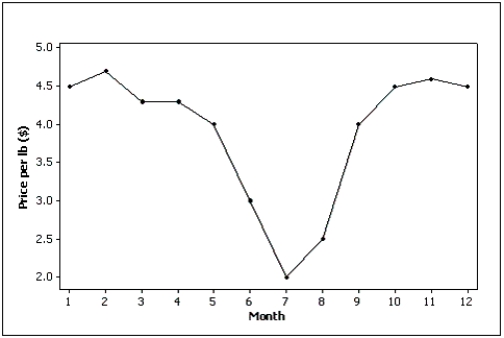
Definitions:
Fitness
The ability of an organism to survive and reproduce in its environment, often influenced by genetic adaptation.
Statistical Measure
A quantitative representation derived from a sample or population, used to summarize or describe characteristics of the data.
Phylogenetic Tree
A diagram that represents the evolutionary relationships among various biological species or entities based upon similarities and differences in their physical or genetic characteristics.
Maximum Likelihood
A statistical approach used to estimate parameters of a model given certain evidence, often used in phylogenetic analysis and other areas of biology.
Q5: a)The stock of Trudeau Corporation went from
Q23: Give an example of interval data that
Q51: Which of the following measures of variability
Q64: A line chart showing the number of
Q65: The index which gives equal weight to
Q69: Which of the following is a property
Q130: The Y-intercept,b<sub>0</sub>,of the least squares line <img
Q133: It is speculated that the number of
Q158: If two equally likely events A and
Q222: The precision provided by the numerical techniques