True/False
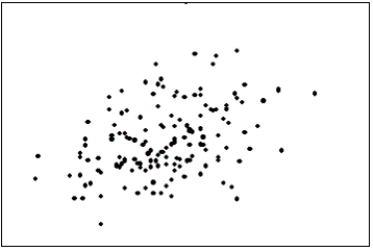
The first scatter diagram below shows a stronger linear relationship than the second scatter diagram.(Assume the scales on both scatter diagrams are the same.) 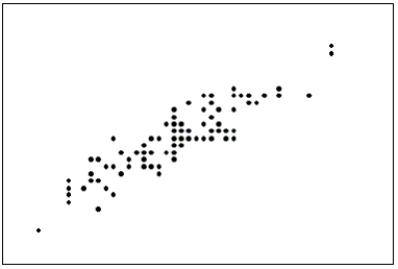
Definitions:
Related Questions
Q15: {Weights of Police Officers Narrative} What does
Q25: If a stock is held for less
Q27: _ techniques give you the big picture
Q57: Which measure of central location can be
Q83: Specialists are now able to keep their
Q102: If the data in a scatter diagram
Q119: Pie charts only show _,not _.This means
Q140: Compare the two histograms below.Which statement is
Q228: Chebysheff's Theorem states that the percentage of
Q248: If the correlation coefficient r = 1.00,then