Oil Quality and Price
Quality of oil is measured in API gravity degrees--the higher the degrees API,the higher the quality.The table shown below is produced by an expert in the field who believes that there is a relationship between quality and price per barrel. 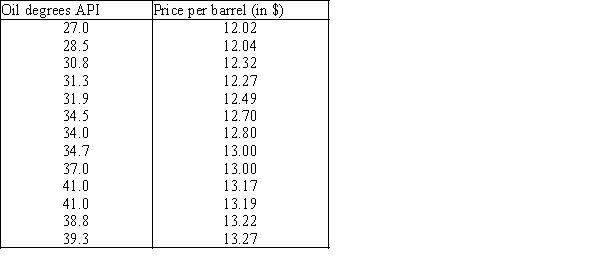 A partial Minitab output follows: Descriptive Statistics Variable N Mean StDev SE Mean Degrees 13 34.60 4.613 1.280 Price 13 12.730 0.457 0.127 Covariances Degrees Price Degrees 21.281667 Price 2.026750 0.208833 Regression Analysis Predictor Coef StDev T P Constant 9.4349 0.2867 32.91 0.000 Degrees 0.095235 0.008220 11.59 0.000 S = 0.1314 R−Sq = 92.46% R−Sq(adj)= 91.7% Analysis of Variance Source DF SS MS F P Regression 1 2.3162 2.3162 134.24 0.000 Residual Error 11 0.1898 0.0173 Total 12 2.5060
-{Oil Quality and Price Narrative} Use the regression equation 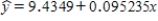 to determine the predicted values of y.
Definitions:
Associative Behaviors
are actions or responses that are learned through associations between stimuli and responses, forming the basis of behavioral conditioning.
Respondent Behavior
A behavioral response to stimuli that is conditioned through certain environmental or physiological triggers, as detailed in classical conditioning.
Classically Conditioned
The process by which a neutral stimulus becomes associated with an innately meaningful stimulus and acquires the capacity to evoke a similar response.
Observational Learning
Learning that occurs through observing the behavior of others and the outcomes of those behaviors.
Q2: {Coffee Narrative} Can we conclude at the
Q8: A regression analysis between weight (y in
Q14: {Advertisement Narrative} Conduct the test at the
Q77: In a multiple regression model,the probability distribution
Q82: {Game Winnings & Education Narrative} Use the
Q106: {Income and Education Narrative} Draw a scatter
Q137: A chi-squared test of a contingency table
Q161: If we want to perform a one-tail
Q196: A prediction interval for a particular y
Q213: {Truck Speed and Gas Mileage Narrative} What