Oil Quality and Price
Quality of oil is measured in API gravity degrees--the higher the degrees API,the higher the quality.The table shown below is produced by an expert in the field who believes that there is a relationship between quality and price per barrel. 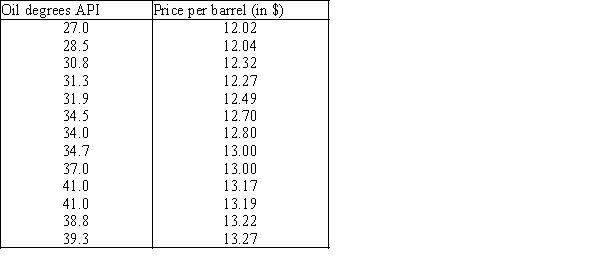 A partial Minitab output follows: Descriptive Statistics Variable N Mean StDev SE Mean Degrees 13 34.60 4.613 1.280 Price 13 12.730 0.457 0.127 Covariances Degrees Price Degrees 21.281667 Price 2.026750 0.208833 Regression Analysis Predictor Coef StDev T P Constant 9.4349 0.2867 32.91 0.000 Degrees 0.095235 0.008220 11.59 0.000 S = 0.1314 R−Sq = 92.46% R−Sq(adj)= 91.7% Analysis of Variance Source DF SS MS F P Regression 1 2.3162 2.3162 134.24 0.000 Residual Error 11 0.1898 0.0173 Total 12 2.5060
-{Oil Quality and Price Narrative} Use the predicted values and the actual values of y to calculate the residuals.
Definitions:
Context Attribute
The context in which an event occurred, which can be a retrieval cue
Context Cues
Environmental or situational indicators that affect how behaviors and responses are displayed or interpreted.
Spatial
Relating to space or spatial relationships; involves the ability to visualize and manipulate objects and their positions in space.
Biochemistry Test
A scientific examination or evaluation that involves analyzing biomolecules and biochemical processes within and related to living organisms.
Q19: If the coefficient of correlation is −0.60,then
Q56: A chi-squared test of a contingency table
Q58: {UV's and Skin Cancer Narrative} Calculate the
Q78: The nonparametric counterpart to the Pearson correlation
Q110: Which of the following is not an
Q129: A chi-squared test of a contingency table
Q143: A zero correlation coefficient between a pair
Q159: A multiple regression analysis involving three independent
Q165: The Friedman test statistic is approximately chi-squared
Q235: If the coefficient of correlation is 0.90,then