Oil Quality and Price
Quality of oil is measured in API gravity degrees--the higher the degrees API,the higher the quality.The table shown below is produced by an expert in the field who believes that there is a relationship between quality and price per barrel. 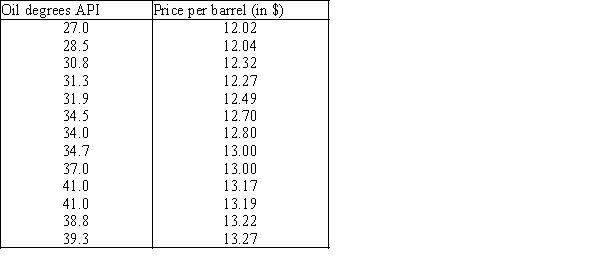 A partial Minitab output follows: Descriptive Statistics Variable N Mean StDev SE Mean Degrees 13 34.60 4.613 1.280 Price 13 12.730 0.457 0.127 Covariances Degrees Price Degrees 21.281667 Price 2.026750 0.208833 Regression Analysis Predictor Coef StDev T P Constant 9.4349 0.2867 32.91 0.000 Degrees 0.095235 0.008220 11.59 0.000 S = 0.1314 R−Sq = 92.46% R−Sq(adj)= 91.7% Analysis of Variance Source DF SS MS F P Regression 1 2.3162 2.3162 134.24 0.000 Residual Error 11 0.1898 0.0173 Total 12 2.5060
-{Oil Quality and Price Narrative} Use the residuals to compute the standardized residuals.
Definitions:
Increasing
describes a situation or process where there is a growth or addition in quantity, size, number, or extent.
Negative Slope
A line or curve on a graph that descends from left to right, indicating an inverse relationship between two variables.
Vertical Line
In geometry, a straight line that runs up and down the page, perpendicular to the horizon.
Slope
is a measure of the steepness or inclination of a line, calculated as the ratio of the vertical change to the horizontal change between two points on the line.
Q2: In simple linear regression,which of the following
Q22: To test for interaction between factors A
Q30: In stepwise regression procedure,the independent variable with
Q33: A regression analysis between sales (in $1000)and
Q36: If the coefficient of correlation is 1.0,then
Q78: {Oil Quality and Price Narrative} Does it
Q97: The Kruskal-Wallis test is always one tailed.The
Q108: There are two critical factors in identifying
Q112: To use the Durbin-Watson test to test
Q234: If the variance of the errors is