Oil Quality and Price
Quality of oil is measured in API gravity degrees--the higher the degrees API,the higher the quality.The table shown below is produced by an expert in the field who believes that there is a relationship between quality and price per barrel. 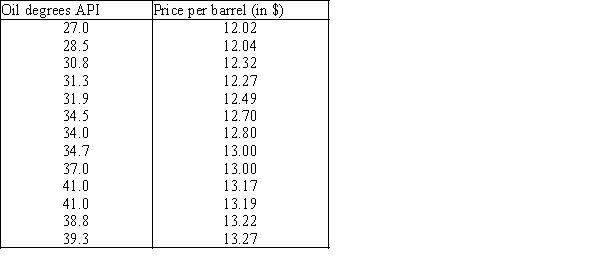 A partial Minitab output follows: Descriptive Statistics Variable N Mean StDev SE Mean Degrees 13 34.60 4.613 1.280 Price 13 12.730 0.457 0.127 Covariances Degrees Price Degrees 21.281667 Price 2.026750 0.208833 Regression Analysis Predictor Coef StDev T P Constant 9.4349 0.2867 32.91 0.000 Degrees 0.095235 0.008220 11.59 0.000 S = 0.1314 R−Sq = 92.46% R−Sq(adj)= 91.7% Analysis of Variance Source DF SS MS F P Regression 1 2.3162 2.3162 134.24 0.000 Residual Error 11 0.1898 0.0173 Total 12 2.5060
-{Oil Quality and Price Narrative} Plot the residuals against the predicted values  .
.
Definitions:
Production Process
The sequence of operations that transforms raw materials or components into finished goods or services.
Standardized Units
Units of measure that have been normalized to a consistent or common standard to ensure uniformity in production, reporting, or analysis.
Job Order Costing
A method of costing that assigns costs to specific batches or job orders, suitable for customized or distinct products.
Periodic Costing
An accounting method that allocates costs to accounting periods, rather than products, useful for companies with varying production levels.
Q8: Multiple regression has four requirements for the
Q31: Multicollinearity is present when there is a
Q36: If the coefficient of correlation is 1.0,then
Q106: {Coffee Narrative} What is the p-value of
Q129: {Motorcycle Fatalities Narrative} Test at the 1%
Q158: If you reject H<sub>0</sub> in a test
Q174: {Marc Anthony Concert Narrative} Plot the residuals
Q175: If the error variable ε is normally
Q189: The coefficient of _ measures the amount
Q256: {Trivia Games & Education Narrative} Determine the