Life Expectancy
An actuary wanted to develop a model to predict how long individuals will live.After consulting a number of physicians,she collected the age at death (y),the average number of hours of exercise per week (x1),the cholesterol level (x2),and the number of points that the individual's blood pressure exceeded the recommended value (x3).A random sample of 40 individuals was selected.The computer output of the multiple regression model is shown below. THE REGRESSION EQUATION IS y = 55.8 + 1.79x1− 0.021x2− 0.061x3 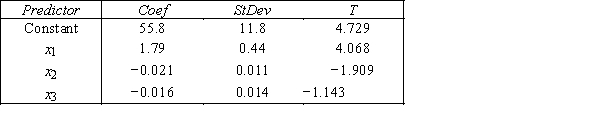 S = 9.47 R−Sq = 22.5% ANALYSIS OF VARIANCE
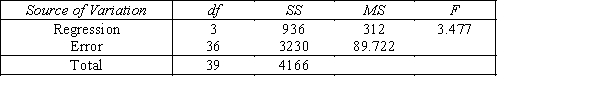
-{Life Expectancy Narrative} Is there sufficient evidence at the 5% significance level to infer that the number of points that the individual's blood pressure exceeded the recommended value and the age at death are negatively linearly related?
Definitions:
Population Mean
The population mean is the average value of a population attribute, computed by summing all the values in the population and dividing by the total number of values.
Sample Proportion
The ratio of members in a sample that have a particular characteristic to the total number of members in the sample.
Standard Error
The standard deviation of the sampling distribution of a statistic, especially of the mean.
Sample Mean
The average value calculated from a sample of observations from a larger population.
Q8: Suppose that the sample regression equation of
Q9: The Spearman rank-correlation coefficient can only take
Q27: Which of the following is not true
Q106: {Student's Final Grade Narrative} What is the
Q129: A chi-squared test of a contingency table
Q132: In performing a regression analysis which of
Q146: In order to test the validity of
Q146: To apply the Wilcoxon rank sum test
Q156: The degrees of freedom for the test
Q233: An outlier is an observation that is