Life Expectancy
An actuary wanted to develop a model to predict how long individuals will live.After consulting a number of physicians,she collected the age at death (y),the average number of hours of exercise per week (x1),the cholesterol level (x2),and the number of points that the individual's blood pressure exceeded the recommended value (x3).A random sample of 40 individuals was selected.The computer output of the multiple regression model is shown below. THE REGRESSION EQUATION IS y = 55.8 + 1.79x1− 0.021x2− 0.061x3 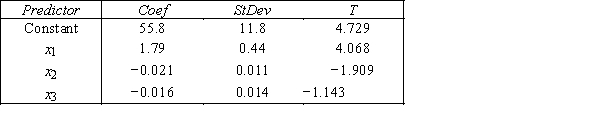 S = 9.47 R−Sq = 22.5% ANALYSIS OF VARIANCE
-{Life Expectancy Narrative} Is there enough evidence at the 1% significance level to infer that the average number of hours of exercise per week and the age at death are linearly related?
Definitions:
Economic Analysis
The systematic approach to determining the optimal use of scarce resources, examining the costs and benefits of economic decisions.
Product Promotion
Activities undertaken by a company to increase awareness, create interest, and generate sales or acceptance of its products or services.
Monopolistic Competition
A market structure characterized by many firms selling products that are similar but not identical, leading to competition based on factors other than price.
Pure Competition
A market structure characterized by an extremely large number of sellers, none of which can significantly influence price or market conditions due to the homogeneity of the product being sold.
Q14: {Advertisement Narrative} Conduct the test at the
Q20: A high correlation between two independent variables
Q52: When all the actual values of y
Q58: When we test for differences between two
Q66: {Senior Medical Students Narrative} Predict the final
Q74: The Pearson coefficient of correlation r equals
Q101: The total variation in y is equal
Q125: The model y = β<sub>0</sub> + β<sub>1</sub>x<sub>1</sub>
Q154: {Oil Quality and Price Narrative} Predict with
Q189: The coefficient of _ measures the amount