Essay
The trend line and seasonal indexes shown below were computed from four weeks of daily observations.Forecast the seven values for the next week.
Trend Line:  = 145 + 1.66t (t = 1,2,3,...28)
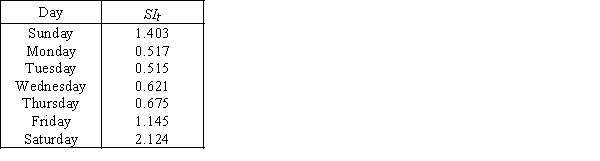
Definitions:
Related Questions
Q12: The validity of any statistical outcome depends
Q14: Which of the following would not be
Q16: Another term for a first-order polynomial model
Q18: _ regression is an iterative procedure that
Q22: In what order do these layers occur
Q38: Which of the following biomes is
Q46: {Car Audio Store Narrative} Use your answers
Q51: If a p control chart finds six
Q105: A time series is shown in the
Q200: The trend line <img src="https://d2lvgg3v3hfg70.cloudfront.net/TB4388/.jpg" alt="The trend