A time series is shown in the table below: 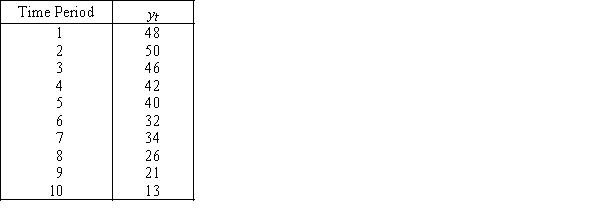
a.Plot the time series to determine which of the trend models appears to fit better.
b.Use the regression technique to calculate the linear trend line and the quadratic trend line.Which line fits better? Use the best model to forecast the value of y for time period 7.
Definitions:
Broad Concepts
General ideas or categories that encompass multiple specific elements or instances, used to organize and categorize complex information.
Detailed Subgroupings
Specific and finely divided categories within a larger group, allowing for more precise classification or analysis.
Strategy-Based Solutions
Approaches that involve carefully planned methods and procedures to address specific problems or achieve intended outcomes.
Algorithms
A step-by-step procedure or formula for solving a problem or completing a task.
Q2: The difference between expected payoff under certainty
Q6: In the case of comparing two population
Q20: {30 Samples Production Narrative} Calculate the mean
Q31: The Kruskal-Wallis test is an extension of
Q33: Assume that the control limits of an
Q36: Which of the following is not a
Q74: Suppose you are producing a product implementing
Q77: If we have 5 years of monthly
Q84: {Car Audio Store Narrative} What is the
Q101: A malfunction in the process goes unnoticed