Two forecasting models were used to predict the future values of a time series.These are shown in the accompanying table,together with the actual values. 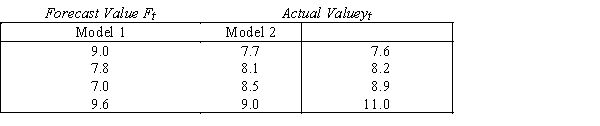 Compute the mean absolute deviation (MAD)and sum of squares for forecast (SSE)for each model to determine which was more accurate.
Definitions:
Correlational Approach
A research method that examines the relationship between two or more variables to determine if they are associated, without inferring causality.
Physiological Recording
The measurement and recording of physical or biological responses, such as heart rate, muscle tension, brain activity, and other bodily functions.
Statistical Procedures
A set of methods used to collect, analyze, interpret, and present data in a meaningful way.
Research Methods
Systematic techniques used in scientific studies to collect, analyze, and interpret data.
Q6: The purpose of using the moving average
Q6: The statistical techniques used to analyze ordinal
Q12: {Liquor Sales Narrative} A centered 3-year moving
Q19: The situation with major oceanic fishing areas
Q20: {30 Samples Production Narrative} Calculate the mean
Q28: A two-sample t-test is the parametric counterpart
Q75: The model y<sub>t</sub> = T<sub>t</sub>×C<sub>t</sub>×S<sub>t</sub>×R<sub>t</sub> that assumes
Q78: The nonparametric counterpart to the Pearson correlation
Q138: Use the Wilcoxon rank sum test on
Q197: Forecasts based on trend and seasonality are