Use the following information to answer the following questions.
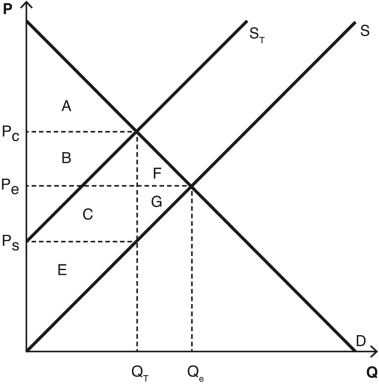
The following graph depicts a market where a tax has been imposed.Pe was the equilibrium price before the tax was imposed,and Qe was the equilibrium quantity.After the tax,PC is the price that consumers pay,and PS is the price that producers receive.QT units are sold after the tax is imposed.NOTE: The areas B and C are rectangles that are divided by the supply curve ST.Include both sections of those rectangles when choosing your answers.

-Which areas represent the deadweight loss created as a result of the tax?
Definitions:
Average Total Cost
Represents the per-unit total cost of production, calculated by dividing the total cost by the total quantity produced.
Falling
The process or action of moving downwards, typically used in economics to describe a decrease in prices or values.
Short Run
In economics, the short run refers to a period during which at least one of a firm's inputs cannot be changed, limiting its capacity to adjust to demand changes.
Long Run
A period during which all factors of production and costs are variable, allowing full adjustment to any change in market conditions.
Q5: The opportunity cost of every investment in
Q19: Barney owns a bagel business in New
Q35: How many fishermen will choose to operate
Q37: If the price of Gatorade increases,the equilibrium
Q49: Karolina owns a small diner,where she works
Q109: A monopoly<br>A) exists when either the buyer
Q121: A poker player wins some cash.Which use
Q133: Use the concept of a positive externality
Q143: Congestion charges cause the price of driving
Q151: Why would most economists (and all free-market