Multiple Choice
The following plot shows two titration curves,each representing the titration of 50.00 mL of 0.100 M acid with 0.100 M NaOH. 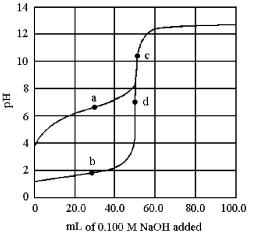
-Which point a-d represents the equivalence point for the titration of a weak acid?
Definitions:
Related Questions
Q6: Compounds that absorb water from the atmosphere
Q44: A galvanic cell uses the reaction<br>Mg(s)+ Pb<sup>2+</sup>(aq)→
Q45: Which picture represents the system with the
Q49: 0.10 M potassium chromate is slowly added
Q64: The reaction A<sub>2</sub> + B<sub>2</sub> ⇌ 2
Q68: According to the diagram above,<br>A)ΔG° is positive
Q132: Indicate all the Br∅nsted-Lowry acids in the
Q146: Which of the following titrations result in
Q173: Hydrogen,H<sub>2</sub>,has a very low boiling point.What is
Q187: Which is the best acid to use