Picture (1) shows the electron populations of the bands of MO energy levels for elementary silicon. 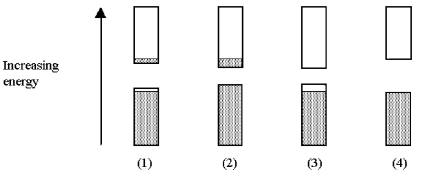
-Which picture (1) -(4) shows the electron populations when the silicon is doped with arsenic?
Definitions:
Q34: Which of the following compounds is most
Q40: Carbon-14,which is present in all living tissue,radioactively
Q46: What is not part of the sol-gel
Q62: [Co(NH<sub>3</sub>)<sub>5</sub>NCS]<sup>2+</sup> and [Co(NH<sub>3</sub>)<sub>5</sub>SCN]<sup>2+</sup> are examples of _
Q62: What terminology best describes the bonding in
Q84: The sum of the masses of the
Q162: Which two amino acids form the dipeptide
Q166: What is not a true statement?<br>A)BeO is
Q181: Which has the smallest atomic radius?<br>A)Sc<br>B)V<br>C)Ni<br>D)Zn
Q216: Identify the amino acid shown below. <img