Multiple Choice
Figure 15-3
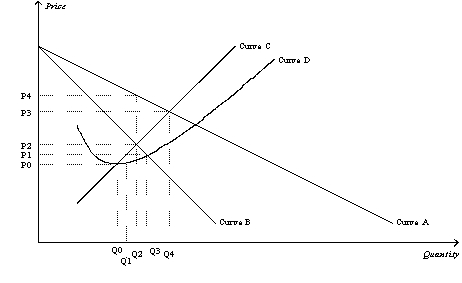
-Refer to Figure 15-3.The average total cost curve for a monopoly firm is depicted by curve
Definitions:
Related Questions
Q8: An example of a transitory change in
Q8: Business owners who care only about making
Q16: Thirsty Thelma owns and operates a small
Q18: The deadweight loss from a 3 pound
Q24: Refer to Figure 15-1.The shape of the
Q44: Goods that are not rival in consumption
Q47: Of the four countries below,the country that
Q48: The deadweight loss that is associated with
Q63: Describe the process by which the market
Q64: Refer to Figure 11-1.The box labeled A