The following regression output is the result of a multiple regression application in which we are interested in explaining the variation in retail price of personal computers based on three independent variables,CPU speed,RAM,and hard drive capacity.However,some of the regression output has been omitted. 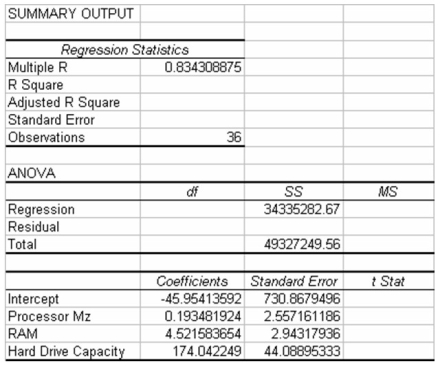 Given this information and your knowledge of multiple regression,what percentage of variation in the dependent variable is explained by the three independent variables in the model?
Definitions:
Variables
Elements, characteristics, or conditions that can change or vary in a mathematical or statistical experiment.
Outliers
Data points that are significantly different from or inconsistent with the remainder of the dataset.
Scatterplot
A type of graph used in statistics to display values for typically two variables for a set of data, showing how much one variable is affected by another.
Blood Pressure
The pressure of circulating blood on the walls of blood vessels, often measured for health assessments.
Q28: Given the partially completed ANOVA table below,the
Q32: If the population correlation between two variables
Q42: The makers of furnace filters recently conducted
Q50: A high coefficient of determination (R<sup>2</sup>)implies that
Q72: Which of the following is true?<br>A)Maximax and
Q80: In a contingency analysis,the greater the difference
Q82: A walk-in medical clinic believes that arrivals
Q86: Each evening,a nationwide retail chain randomly calls
Q116: An investor has $1000 to invest and
Q134: Which of the following statements is true?<br>A)Dummy