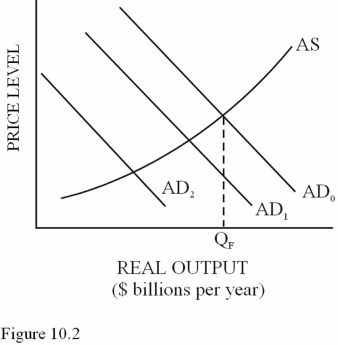
 Suppose the aggregate demand curve in Figure 10.2 increases by a total of $60 billion,from AD2 to AD0. Equilibrium GDP will
Definitions:
Aggregate Demand
The overall demand for all the goods and services in an economy, reflecting the economic activity and consumer spending power.
Keynes's Followers
Individuals or economists who support or develop the theories of John Maynard Keynes, relating to government intervention in the economy to manage aggregate demand.
Monetary Policy
Actions of a central bank, currency board, or other regulatory committee that determine the size and rate of growth of the money supply, which in turn affects interest rates.
MPC
Marginal Propensity to Consume, the proportion of an increase in income that gets spent on consumption.
Q28: In order to maintain a balanced budget
Q47: <span class="ql-formula" data-value="\begin{array}{lrrr}&1998&1999&2000\\\text { Population } &
Q54: Which one of the following statements about
Q55: A decrease in transfer payments works like
Q55: The GDP per capita is the most
Q67: <img src="https://d2lvgg3v3hfg70.cloudfront.net/TB5716/.jpg" alt=" According to Figure
Q68: What are the two essential functions banks
Q77: The line described by the consumption function
Q85: Which of the following is true regarding
Q137: Which of the following is not a