Multiple Choice
Below is a graph illustrating rice and flax production in the countries of Cardassia and Bajor.
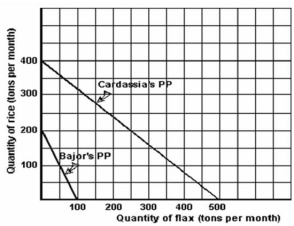
-Refer to the graph above to answer this question.What is the opportunity cost of 100 tons of rice in Bajor?
Definitions:
Related Questions
Q10: Why it is important to check for
Q11: A research report presented to reviewers before
Q14: Which of the following is the best
Q45: To what extent does the Chesapeake transaction
Q70: M&A practitioners utilize nominal cash flows except
Q77: What should (or can)be done to reduce
Q115: What is collusion?
Q135: Suppose that the productivity per worker in
Q143: List four arguments against free trade.
Q150: Refer to the data above to answer