Below is a graphical illustration of a typical firm operating in a monopolistically competitive industry:
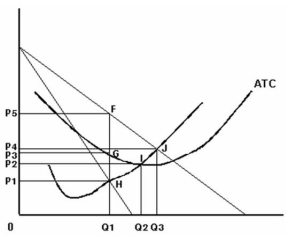
-Refer to the graph above to answer this question.What area graphically represents a profit-maximizing firm's total revenue?
Definitions:
Total Revenue
The total income received by a firm from its sales of goods or services, calculated as the quantity sold times the price per unit.
Price Lowered
A decrease in the cost of a good or service to consumers.
Price Elasticity
A measure of the responsiveness of quantity demanded or supplied of a good to a change in its price.
Quantity Demanded
The quantity of a good that consumers are willing and able to purchase at a given price over a specified period of time.
Q6: To change a mixed methods research study
Q8: In what way does Heil's project illustrate
Q33: What is a 'common property' resource?
Q77: Table 9.3 shows the cost structure for
Q89: Refer to the information above to answer
Q100: If a country wishes to specialize its
Q109: Refer to the above information to answer
Q132: Refer to the above information to answer
Q136: Refer to the above information to answer
Q156: Refer to the above information to answer