Multiple Choice
In the graph below six short-run average cost curves labeled a through f are illustrated.
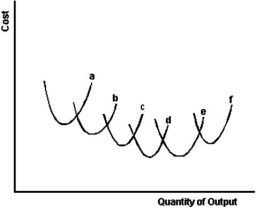
-Refer to the graph above to answer this question.Which set of short-run average cost curves illustrates diseconomies of scale?
Definitions:
Related Questions
Q3: Explain how government can integrate external benefits
Q14: A new bakery has just opened,and in
Q22: Refer to the graph above to answer
Q51: What is the significance of the minimum
Q75: Refer to the information above to answer
Q81: Refer to the graph above to answer
Q84: A market can be too small if
Q125: Refer to the information above to answer
Q161: Which of the following products has the
Q177: Refer to the information above to answer