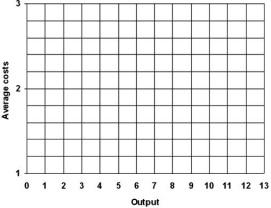
The table below contains short run average cost data for five different plant sizes for C3PO Technologies Ltd.

a)On the grid in the figure below,graph the short-run average cost curves for the five plants. 
b)What is the right-size of plant for each of the following output levels:2,4,6,8 and 10?
c)Do a sketch of the long-run average cost curve in the graph above.
d)What plant size would C3PO need to use in order to achieve MES?
e)If C3PO is producing an output level of 6 in plant size 4,does excess capacity exist?
Definitions:
Q7: The figure below illustrates a series of
Q15: Refer to the above graph to answer
Q31: If a product has many substitutes,which of
Q43: What are the four strengths of a
Q54: What is the term for the costs
Q58: Define the following: a)utility b)marginal utility c)the
Q61: Refer to the diagram below and indicate
Q74: Explain why average and marginal revenues are
Q126: What is the sum of total variable
Q148: Refer to the above graph to answer