The following graph shows the total utility obtained from rice crackers and beer by Carla.
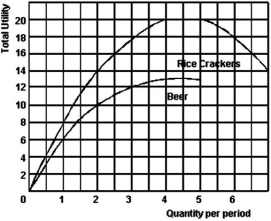
-Refer to the above graph to answer this question.If the price of rice crackers are $3,beer is $2,and Carla has a budget of $15,how much of each will she purchase if she wishes to maximize her total utility?
Definitions:
Firm's Willingness
Refers to a company's readiness to engage in activities like selling at certain prices or producing specific quantities.
Willingness to Pay
The maximum amount an individual is prepared to sacrifice to procure a good or service or to avoid something undesirable.
Economic Signals
Indicators or signs used by consumers and producers to guide their actions, such as prices, which indicate when to buy or sell products or resources.
Producers
Entities that create, manufacture, or supply goods and services for the purpose of selling to consumers, businesses, or other producers.
Q24: Refer to the above information to answer
Q31: Refer to the graph above to answer
Q33: In which book is the diamond-water paradox
Q65: Suppose that a firm,operating efficiently,doubles the size
Q69: Refer to the above graph to answer
Q102: Refer to the information above to answer
Q121: Refer to the above information to answer
Q122: What do products such as household electricity,tobacco
Q159: What is the formula used to calculate
Q178: Refer to the graph above to answer