Multiple Choice
The graph below shows the supply and demand for tickets to a Raptors basketball game.
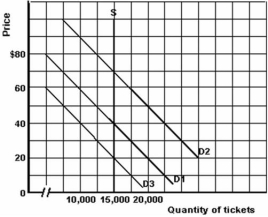
-Refer to the graph above to answer this question.What is the supply elasticity in the $30 to $40 range?
Definitions:
Related Questions
Q11: Refer to Table 3.2 to answer this
Q12: What does the diamond-water paradox refer to?<br>A)The
Q35: What is the term for a table
Q48: Refer to the information above to answer
Q50: What is significant about the level of
Q71: What will happen if both the demand
Q110: "The SRAC and LRAC curves are both
Q114: What is the shape of the LRAC
Q132: Which of the following are fixed costs
Q137: What is meant by rationing?<br>A)A method of