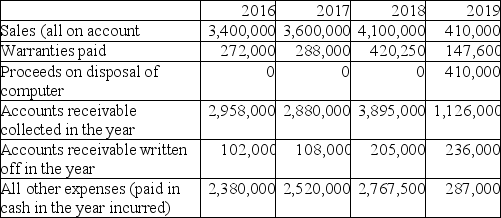
Computer Consulting Limited was started in early 2016 and continued to operate until early 2019,when it was wound up due to disputes between the two principal shareholders.When it started,the company used these accounting policies:
1.Use straight-line depreciation for the firm's only asset,a computer which cost $1,100,000 and has an estimated useful life of four years.
2.Estimate warranty expense as 9% of sales.
3.Estimate bad debts expense as 5% of sales.
Derive the annual net cash flows for 2016 to 2018.For the year-end balance for 2019,assume accounts receivable,allowance for doubtful accounts,and the warranty accrual are $0,as the firm wound itself up during the year and all timing differences have been resolved.
Definitions:
Accounts Receivable
Money owed to a company by customers for products or services that have been delivered or used but not yet paid for.
Income Tax Payable
This represents the amount of income tax that a company owes to the government but has not yet paid.
Sales
The transactions involving the exchange of goods or services for money, reflecting the primary revenue activity of a business.
Free Cash Flow
The amount of cash generated by a business after accounting for operational expenses and capital expenditures, available for distribution or reinvestment.
Q5: Nova Construction Company (NCC)entered into a contract
Q6: Which of the following images could describe
Q6: Which statement is correct about the impact
Q18: Any high risk for a particular technology
Q68: In the chart below,identify the revenue recognition
Q69: Which statement is not correct?<br>A)Cash accounting is
Q86: At a depth of about 10 meters
Q97: Which of the following does not describe
Q108: Which statement is correct about cost allocation
Q118: The following event occurred after the company's