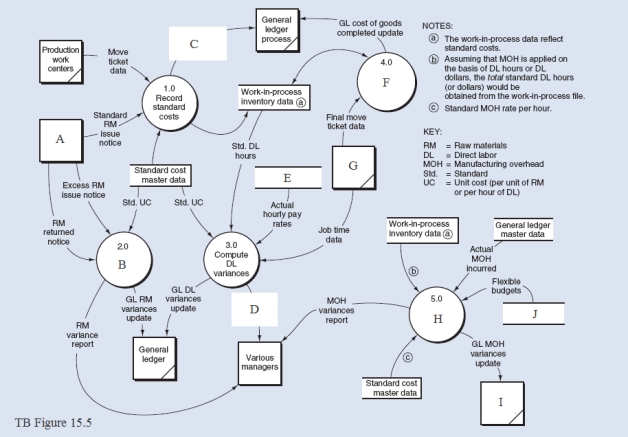
TB Figure 15.5 displays a Level 0 DFD - Cost Accounting: Variance Analysis.Match the items in the following alphabetical list to the missing items (A - J) in the diagram.1.Budgets master data
6.Employee/payroll master data
2.Close manufacturing orders
7.General ledger process
3.Compute MOH variances
8.GL standard costs applied update
4.Compute RM quantity variance
9.Inventory process
5.DL variance report
10.Production work centers
Definitions:
Resource Allocation
The process of allocating resources, including capital, labor, and materials, among competing uses or projects in an efficient manner.
Production Possibilities Curve
The Production Possibilities Curve (PPC) is a model that shows the various combinations of two goods or services that an economy can produce, given its resources and technology, illustrating the concept of opportunity cost.
Unemployment Rate
The percentage of the labor force unemployed at any time.
Technological Advance
The development and application of innovative processes, equipment, or software that enhances productivity, efficiency, or quality.
Q1: In an OE/S process, a sales order
Q2: The purchase order triggers the make payment
Q31: _ of financial information is a potential
Q48: In a logical DFD for the general
Q51: The chief financial officer usually has direct
Q56: Payroll reports may be provided to all
Q60: The modular approach forces the users to
Q71: A(n) _ benefit is one that is
Q83: The vendor sends a _ to notify
Q95: _ reflect the start and stop times