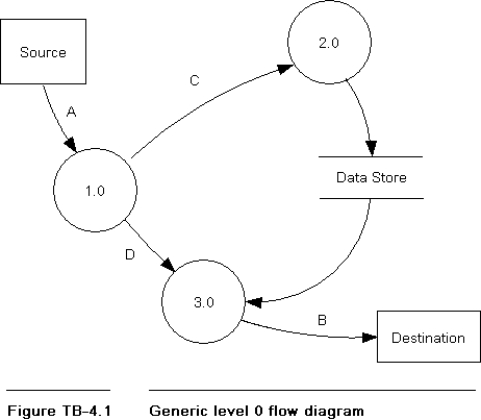
Figure TB-4.1 is a "generic" level 0 data flow diagram, taken from Figure 4.5 in the text.Required:
Using good data flow diagram construction techniques draw a diagram to explode bubble 3.0 to its next lower level.Diagram 3.0 should contain three processes, appropriately numbered, and should contain the following data flows in addition to those in the level 0 diagram (see NOTE):
a.Flow H runs from the first process to the second.
b.Flow I runs from the first process to the third.
c.Flows J and K run from the second process to the third.NOTE: Assume that the flows shown in the level 0 diagram affect diagram 3.0 as follows:

Definitions:
Stock
A form of investment that indicates one has a stake in a company and entails a portion of the company's assets and profits.
Expected Rate of Return
The profit or loss that an investor anticipates on an investment, expressed as a percentage of the investment’s cost.
Recession
A recession is an economic downturn spread across the economy lasting more than a few months, often visible in real GDP, real income, employment, industrial production, and wholesale-retail sales.
Booming Economy
A fast-growing economy characterized by rapid increases in production, sales, and typically, employment levels.
Q4: Establishing a viable internal control system is
Q6: The section of Sarbanes Oxley that requires
Q28: Electronic document management (EDM) includes all of
Q29: _ activities include retrieving data from storage,
Q31: A systems flowchart is a graphical representation
Q33: In selecting a vendor, a buyer may
Q53: A situation in which a particular supplier
Q119: Supply chain management (SCM) is the combination
Q120: Purchase requisitions are compiled in a _
Q165: The model that includes abstract types that