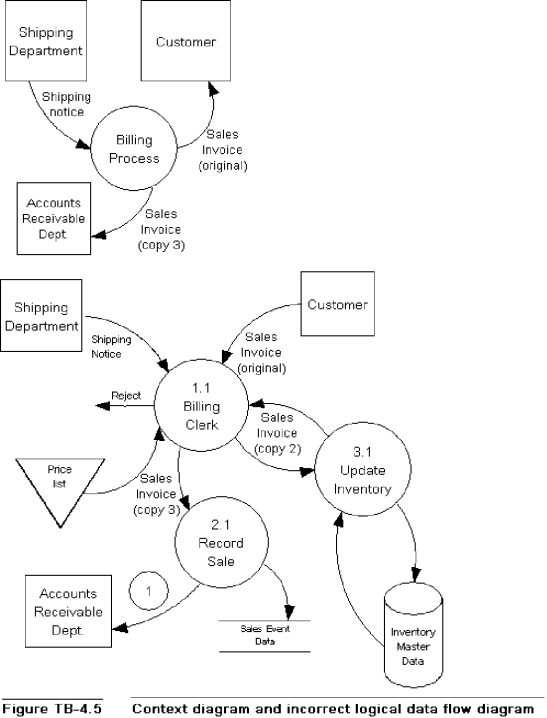
Figure TB-4.5 shows a level 0 logical data flow diagram for a billing system.Also shown for reference is the context diagram for the system.The logical data flow diagram intentionally violates several of the guidelines and other techniques presented in the text for drawing data flow diagrams.
Required:
Identify as many of the errors in the logical data flow diagram construction as you can.In the logical data flow diagram,place consecutive numbers (each in a circle)next to the points at which the errors exist.On your solution sheet,list the numbers and write a one- to two-sentence description of each error and what the corrected diagram should depict.If an error occurs in more than one place,mark each occurrence of the error.Error 1 is provided as an example of how to construct the solution.Do not identify nor correct any errors that may exist on the context diagram.

Definitions:
Large Producers
Entities that produce goods or services at a high volume, often dominating the market or industry sector they operate within.
Pure Competition
A term synonymous with purely competitive industry, denoting a market scenario where numerous firms offer identical products, ensuring no singular entity can control the market price.
Monopolistic Competition
A market structure where many firms sell similar but not identical products, allowing for some degree of market power.
Oligopoly
A market structure characterized by a small number of firms that have significant control over market prices and where strategic interactions between the firms play a crucial role.
Q22: Which one of the following has the
Q22: Enterprise systems<br>A) integrate back-office and front-office processes<br>B)
Q24: At which level of the organization are
Q45: SPAM is unsolicited unwanted mail.
Q59: A field is a collection of related
Q64: _ is data presented in a form
Q71: The cardinality constraint is used to specify
Q101: Data independence refers to decoupling the data
Q107: Processes that include distribution,manufacturing,and accounting operations are
Q114: A control goal that is a measure