Multiple Choice
The histogram shows the cost of living,in dollars,in 32 Canadian towns. 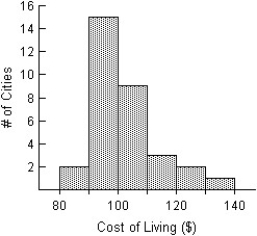
Assess the accessibility and importance of financial information for investors using the internet.
Recognize the role and legal relevance of proxies in corporate governance.
Learn about the significance of record date, income stocks, and dividend payments to shareholders.
Understand the valuation and capitalization of stocks, including the distinction between large cap stocks and preferred stocks.
Definitions:
Related Questions
Q3: Shown below are the histogram and summary
Q8: The histogram shows the sizes (in acres)of
Q9: For the model <img src="https://d2lvgg3v3hfg70.cloudfront.net/TB3448/.jpg" alt="For the
Q14: The boxplots display case prices (in dollars)of
Q16: The speed vehicles travelled on a local
Q29: Long-term notes payable
Q82: Based on the Normal model for car
Q90: The ages of the 21 members of
Q103: Net loss reduces a company's retained earnings
Q209: A non-classified balance sheet typically does not