Shown below are the boxplot,the histogram and summary statistics for the highest temperatures ever recorded (in °F) in 32 different states in the U.S.A. 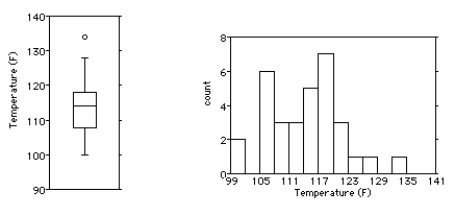

Write a few sentences describing the distribution.
Definitions:
Stress Management Competencies
Skills and abilities that enable individuals to handle stress effectively in personal and professional contexts.
Self-Maintenance Competencies
Skills and abilities that enable an individual to independently manage their personal and professional development.
HR Practices
Strategies, policies, and practices implemented by the Human Resources department to manage and support the workforce.
Cultural Assimilation
The process by which individuals or groups adopt the culture of another group, losing their original cultural identity.
Q3: A popular soft drink company periodically sets
Q3: A college admissions officer in the U.S.A.
Q9: Data collected from students in Statistics classes
Q12: A company must decide which of two
Q12: A business owner recorded her annual profits
Q12: Refer to B-There Transportation. Suppose the company
Q16: Barrett Oil Company reported the following balances
Q21: <img src="https://d2lvgg3v3hfg70.cloudfront.net/TB3448/.jpg" alt=" a)-0.798,b)0.009,c)0.084,d)0.948 A)1a,2b,3c,4d B)1b,2c,3d,4a
Q49: The model <img src="https://d2lvgg3v3hfg70.cloudfront.net/TB3448/.jpg" alt="The model
Q137: Refer to Beard Marine. What was the