The table below displays data showing weight gain,in grams,for 12 young rats,three from each of four litters.Three different diets (the treatments)were assigned at random to the three siblings in litter one (block 1).This was repeated for the other three litters (blocks 2,3,and 4). 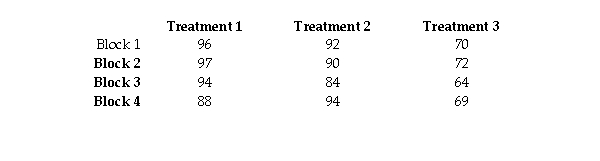
Conduct a Friedman test at the 0.05 level of significance to determine if there are differences between the three diets.
Definitions:
Status Symbols
Items or actions that serve to signify a person's social position, wealth, or prestige.
Management By Objectives
A management strategy model designed to enhance an organization's performance by establishing clear goals mutually agreed upon by both the management and the employees.
Ability Of Rewards
The potential of rewards to influence the motivation and behavior of individuals, based on their perceived value and appropriateness.
Learned Competencies
Skills and knowledge acquired through training and experience that contribute to a person's ability to perform certain tasks effectively.
Q1: Consider the following timeline: <img src="https://d2lvgg3v3hfg70.cloudfront.net/TB1619/.jpg" alt="Consider
Q10: A group of persons filled in a
Q12: When Canadian firms need to determine the
Q26: A researcher performed a study to determine
Q46: The target range of annual inflation rates
Q62: The profitability index for this project is
Q67: A researcher wishes to test the effectiveness
Q73: Responses to a survey question are broken
Q78: To calculate the Capital Cost Allowance (CCA),Canadian
Q88: How tall is your average statistics classmate?