Arrows in the energy diagram below represent enthalpy changes occurring in the exothermic formation of a solution:
ΔHsoln = enthalpy of solution
ΔHsolute-solute = enthalpy change involving solute-solute interactions
ΔHsolute-solvent = enthalpy change involving solute-solvent interactions
ΔHsolvent-solvent = enthalpy change involving solvent-solvent interactions 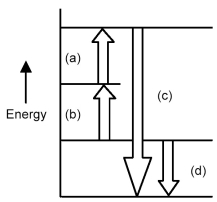
-Which arrow represents ΔHsoln?
Definitions:
MN Blood Type
A blood group system classifying human blood based on the presence or absence of the M and N antigens on the surface of red blood cells.
Genotype Frequency
The proportion of a particular genotype in the population. Compare with allele frequency and phenotype frequency.
Aa Genotypes
Refers to the genetic makeup of an organism having one dominant allele (A) and one recessive allele (a) for a particular trait.
Hardy-Weinberg Predictions
Hardy-Weinberg predictions are mathematical expressions that describe the expected frequencies of genotypes in a population under certain conditions, including random mating and absence of evolutionary forces.
Q8: Which of the elementary reactions shown above
Q20: When 6.000 moles of H<sub>2</sub>(g)reacts with 3.000
Q27: The first-order isomerization reaction: cyclopropane → propene,has
Q60: A carbon dioxide monitoring product provides a
Q94: The following reaction is first order in
Q97: The first-order reaction,SO<sub>2</sub>Cl<sub>2</sub> → SO<sub>2</sub> + Cl<sub>2</sub>,has
Q105: What kind of packing do the anions
Q176: When stopcock A of the open-end manometer
Q179: A solution is made by dissolving 19.5
Q186: An aqueous solution has a normal boiling